

Our Clients


How it Works
We gather the information available in the fleet documents into a secure web database and provide administration facilities.
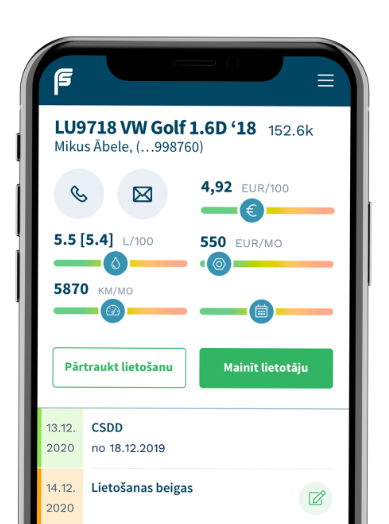
Basic Information
Vehicle Users
Reminders
Terms of Use
Tyres
Usage
Linking – vehicle, user, fuel card
Initial usage documents prepared using Adobe Sign service – signed on phone screen with attached photos
Odometer/remaining fuel readings submitted by users; bookings
Integration of existing GPS data processing systems
Fuel
Guaranteed fuel cost savings of 5%, if up to now you have kept the fuel consumption records for accounting purposes only
Convenient input of information on mobile phone to facilitate monthly data reporting
Automated processing of monthly fuel purchasing data
Quickly discover violations of fuel limits/norms both via reports and graphical fleet consumption display – l/100 km bubble chart
Service
Service costs displayed chronologically provide a technical resume of each vehicle with clearly delineated wear and tear, maintenance and damage costs Independent invoice analysis allows one to identify unfounded costs and react immediately
Technical cost and value loss analysis allows one to make economically-founded decisions on renewing or expanding the fleet – bubble charts, e.g., EUR/100 km or monthly


Basic Information
Vehicle Users Reminders Terms of Use Tyres
Usage
Linking – vehicle, user, fuel card
Initial usage documents prepared using Adobe Sign service – signed on phone screen with attached photos
Odometer/remaining fuel readings submitted by users; bookings
Integration of existing GPS data processing systems
Fuel
Guaranteed fuel cost savings of 5%, if up to now you have kept the fuel consumption records for accounting purposes only
Convenient input of information on mobile phone to facilitate monthly data reporting
Automated processing of monthly fuel purchasing data
Quickly discover violations of fuel limits/norms both via reports and graphical fleet consumption display – l/100 km bubble chart

Service
Service costs displayed chronologically provide a technical resume of each vehicle with clearly delineated wear and tear, maintenance and damage costs Independent invoice analysis allows one to identify unfounded costs and react immediately
Technical cost and value loss analysis allows one to make economically-founded decisions on renewing or expanding the fleet – bubble charts, e.g., EUR/100 km or monthly
Use options
Audit
The performance of your fleet over the last six months will be reviewed and presented in analytical format within a few weeks
SaaS
You can keep your own records, but the result will be exactly the same
Fleetsheet together with data management services
We can save your time and provide independent and efficient data analysis
Route planning
It often turns out that optimal calculation and justification of the mileage required for business primarily saves time and then fuel.